
Chart
A line across the element with the area beneath it filled, drawn from a series you have already
normalised to 0..1.
ui.chart
Example
Section titled “Example”var samples = new UiState<IReadOnlyList<double>>([]);
new UiChart{ Key = "chart", Points = UiValue.From(() => samples.Value), PlotTop = 0.66, Thickness = UiSize.Capped(2d / UiLength.Cell, 2),}
A hairline history across the bottom third of the tile, in the reader’s accent colour - the chart the built-in History Graph widget draws.
Appending points
Section titled “Appending points”var fraction = Math.Clamp((celsius - 20) / 60, 0, 1);samples.Set([.. samples.Peek().TakeLast(59), fraction]);Keep a rolling window and map each raw value onto your own scale before it reaches the tree. The chart carries no axis, unit or range; the producer owns the scale and decides whether it is fixed or follows the data.
| Series | Drawn as |
|---|---|
[] or absent |
Nothing - no line, no fill |
[0.5] |
A flat line across the whole width at half height |
[0, 0.5, 1] |
Rising from the bottom-leading corner to the top-trailing corner of the band |
[1.4, -0.2] |
Clamped to [1, 0] |
A band at the foot of the tile
Section titled “A band at the foot of the tile”PlotTop = 0.66,PlotTop moves the top of the plot band down, leaving the space above for labels. 0 in the series
is the element’s bottom edge and 1 is the band’s top.
A colour of its own
Section titled “A colour of its own”Color = config.AccentColor is { } accent ? UiValue.Of(accent) : UiValue.None<string>(),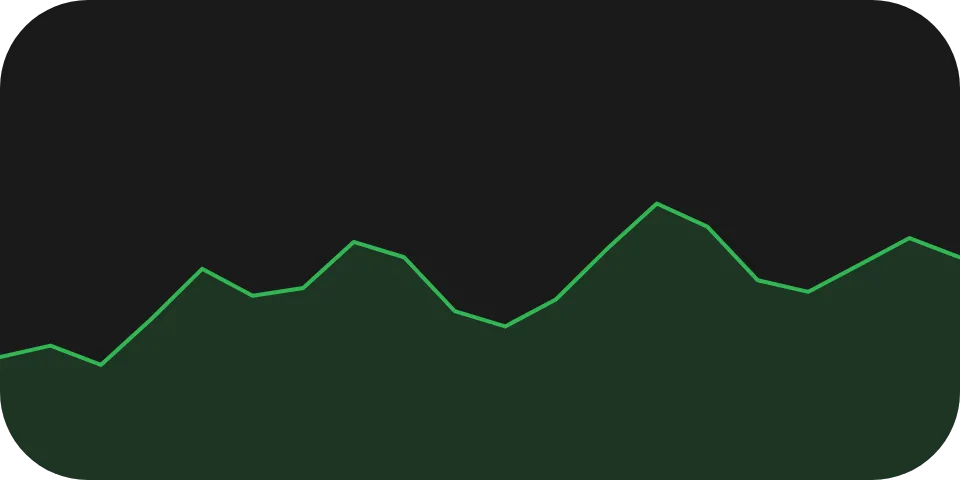
Color is a literal #rrggbb because it encodes data rather than theme. Leave it absent to follow the
reader’s accent colour. See Colours and text.
Properties
Section titled “Properties”| Property | Values | Default | Meaning |
|---|---|---|---|
Points (points) |
Numbers in 0..1, oldest first |
Nothing is drawn | The series as fractions of the plot band. |
Color (color) |
#rrggbb |
The reader’s accent colour | The line and fill colour. |
PlotTop (plotTop) |
0..1 |
0 - the band is the whole element |
Where the band starts, as a fraction of the element’s height. |
Thickness (thickness) |
A length | Left to the reader | The line’s width. |
Events
Section titled “Events”None. A chart is never interactive.
Children
Section titled “Children”None - ui.chart is a leaf.
Layout
Section titled “Layout”A chart follows the ordinary leaf rule on its parent stack’s main axis: mainSize or fill if
declared, otherwise its content extent. A live numeric readout beside a chart should reserve its width
with ui.text’s digits, or the chart shifts whenever the value gains or loses a digit - see
Text. Full model: Sizing.
Reader behaviour
Section titled “Reader behaviour”The geometry is normative; the fixtures in ui-model/fixtures/component-profile/ pin it, including a
dense series and every clamp branch.
- The plot band spans the element’s full width and runs from
plotTopof its height to its bottom edge.0is the bottom of the band,1the top. - Values outside
0..1are clamped, never rejected. - Points sit at equal horizontal spacing, the first on the leading edge and the last on the trailing edge, joined by straight segments with round joins and caps.
- A single point is a flat line across the whole width at its height, not a dot.
- The line is drawn in
colorat0.9opacity,thicknesswide. - The area between the line and the element’s bottom edge is filled in
colorat0.16opacity, with no stroke. - An absent or empty series draws nothing at all - in particular not a flat line along the foot of the band, which would read as a real zero.
- An absent
colormeans the reader’s own accent colour.